Fig. 4
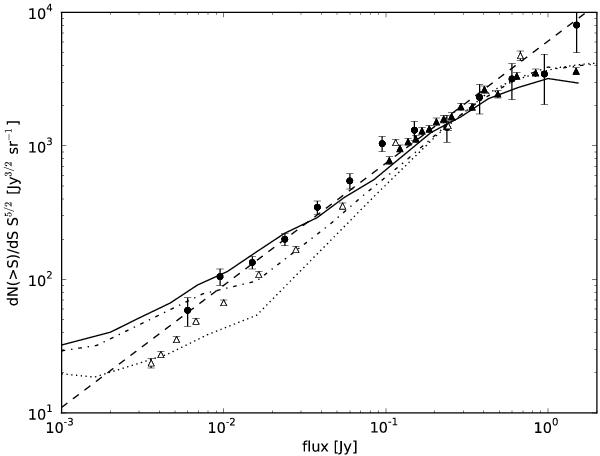
Euclidean-normalized differential source counts for the full 153 MHz catalog of 598 sources, distributed over 14 logarithmic flux bins ranging from 4.75 mJy to 3 Jy (black dots; we have omitted the highest flux bin, containing just one count). Also plotted are 151 MHz source counts by McGilchrist et al. (1990), part of the 7C catalog (black triangles), 153 MHz source counts by Ishwara-Chandra et al. (2010, white triangles), model 151 MHz source counts by Jackson (2005) for a ΛCDM cosmology (dotted line) and an Ωm = 1 cosmology (dash-dotted line), a 151 MHz source count model by Wilman et al. (2008, solid line), and the power-law slope of 0.91 (dashed line) that fits our data points best.
Current usage metrics show cumulative count of Article Views (full-text article views including HTML views, PDF and ePub downloads, according to the available data) and Abstracts Views on Vision4Press platform.
Data correspond to usage on the plateform after 2015. The current usage metrics is available 48-96 hours after online publication and is updated daily on week days.
Initial download of the metrics may take a while.