Fig. 2
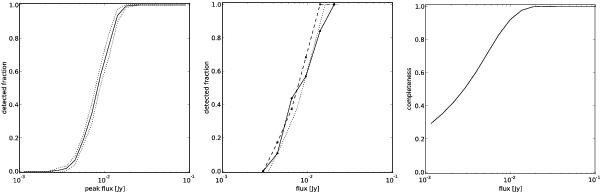
Detection fractions and completeness as a function of flux. Left: result from 20 Monte-Carlo simulations, in which 1000 point sources with varying fluxes were inserted into the residual image, followed by a source extraction. The horizontal axis denotes the input (peak) flux. The solid line is the average detection fraction, and the dotted lines denote the 1σ uncertainty. Middle: result from scaling the peak flux and total flux density of a subset of high S/N sources with varying sizes down to the detection limit, and applying the 5σL detection criteria. The dashed line is the detection fraction as a function of peak flux, the solid line is the detection fraction as a function of total flux density, and the dotted line is the dashed line shifted in flux by 15 percent to approximately match the solid line. Right: estimated completeness of the extracted source catalog as a function of (total) flux limit.
Current usage metrics show cumulative count of Article Views (full-text article views including HTML views, PDF and ePub downloads, according to the available data) and Abstracts Views on Vision4Press platform.
Data correspond to usage on the plateform after 2015. The current usage metrics is available 48-96 hours after online publication and is updated daily on week days.
Initial download of the metrics may take a while.