Free Access
Fig. 1
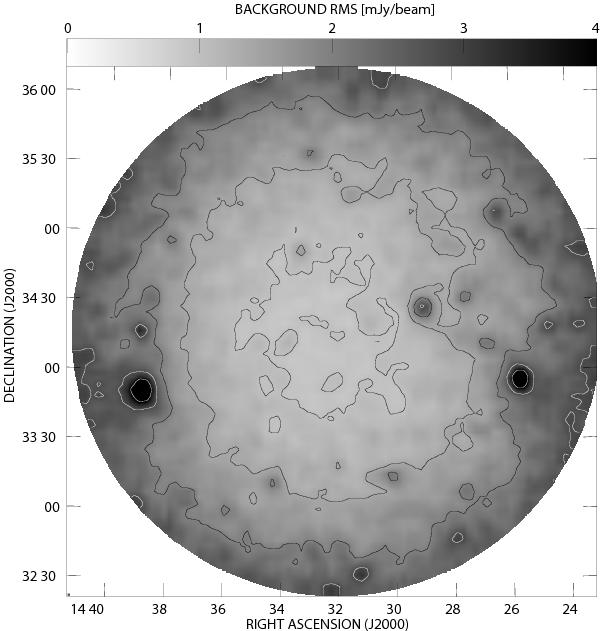
The grayscale map represents the local noise as measured in the (primary beam corrected) Boötes field image. The overplotted contours mark lines of equal rms at [1.0,1.4,2.0,2.8,4.0] mJy beam-1 (white above 2.0 mJy beam-1). The local enhancements in rms coincide with the positions of the brightest sources.
Current usage metrics show cumulative count of Article Views (full-text article views including HTML views, PDF and ePub downloads, according to the available data) and Abstracts Views on Vision4Press platform.
Data correspond to usage on the plateform after 2015. The current usage metrics is available 48-96 hours after online publication and is updated daily on week days.
Initial download of the metrics may take a while.