Free Access
Fig. 2
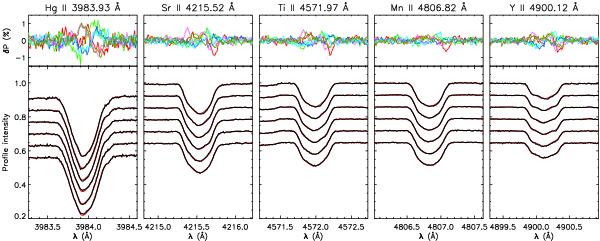
Variability of individual Hg ii, Sr ii, Ti ii, Mn ii, and Y ii spectral lines in μ Lep. The spectra corresponding to different observing nights are offset vertically. The mean profile (thin red line) is plotted below the time-resolved spectra (thick black lines). The upper part of each panel shows residual spectra.
Current usage metrics show cumulative count of Article Views (full-text article views including HTML views, PDF and ePub downloads, according to the available data) and Abstracts Views on Vision4Press platform.
Data correspond to usage on the plateform after 2015. The current usage metrics is available 48-96 hours after online publication and is updated daily on week days.
Initial download of the metrics may take a while.