Free Access
Fig. 1
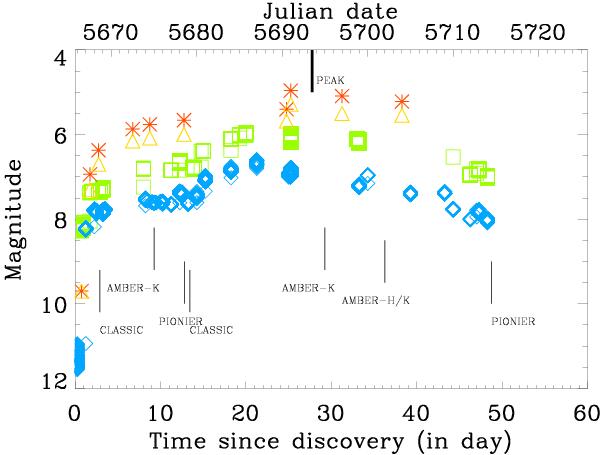
Light curve of T Pyx with the dates of the optical interferometry observations. Blue diamonds indicate a subset of AAVSO data in V, and green squares in I. Orange triangles and red stars indicate H and K band photometry from Mt Abu (India).
Current usage metrics show cumulative count of Article Views (full-text article views including HTML views, PDF and ePub downloads, according to the available data) and Abstracts Views on Vision4Press platform.
Data correspond to usage on the plateform after 2015. The current usage metrics is available 48-96 hours after online publication and is updated daily on week days.
Initial download of the metrics may take a while.