Fig. 8
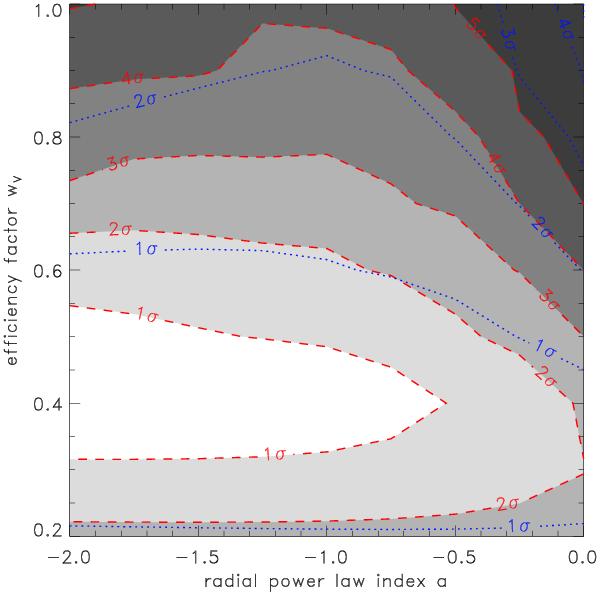
Probability distribution of our model grid for the radial brightness distribution power law index α and the V-band efficiency factor wV. The gray shaded regions with red dashed boundaries show the probability distribution assuming an error of the observations of 1% from Minezaki et al. (2004), leading to  . The blue dotted lines assume an error of 3.5% based on the analysis of the structure function with a
  .
.
Current usage metrics show cumulative count of Article Views (full-text article views including HTML views, PDF and ePub downloads, according to the available data) and Abstracts Views on Vision4Press platform.
Data correspond to usage on the plateform after 2015. The current usage metrics is available 48-96 hours after online publication and is updated daily on week days.
Initial download of the metrics may take a while.