Fig. 9
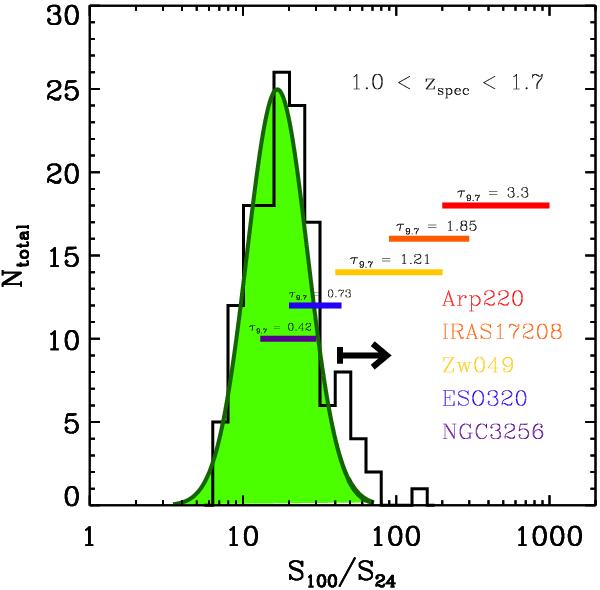
Distribution of the S100/S24 colour among sources in the GOODS-H sample with spectroscopic redshift at 1.0 < z < 1.7. Green line and green shadowed area indicates the Gaussian fit to the distribution and the area beneath it. Coloured bars indicate the range of the S100/S24 colour of several observed SEDs of local LIRGs and ULIRGs at this redshift bin. The silicate optical depths of the local sources, as derived by IRS spectroscopy are also overlaid. The black arrow indicates the position of the high-z 24 μm dropout sample.
Current usage metrics show cumulative count of Article Views (full-text article views including HTML views, PDF and ePub downloads, according to the available data) and Abstracts Views on Vision4Press platform.
Data correspond to usage on the plateform after 2015. The current usage metrics is available 48-96 hours after online publication and is updated daily on week days.
Initial download of the metrics may take a while.