Fig. 6
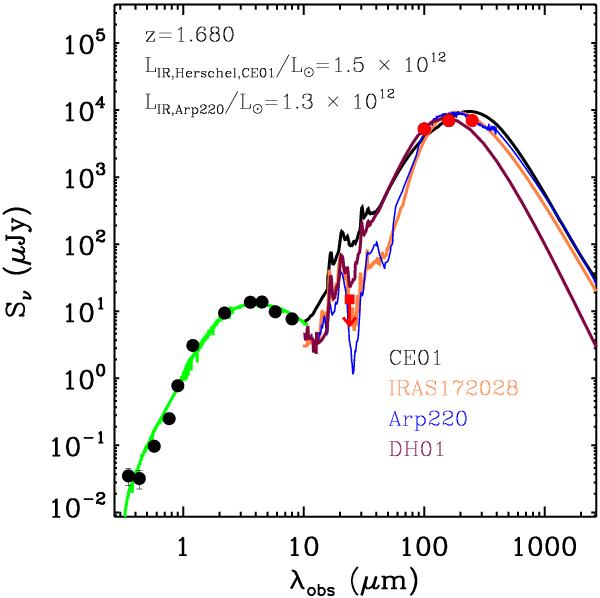
The SED of a dropout at z = 1.68, detected in both the 100- and 160 μm bands, although missed at 24 μm. The optical part is overlaid with the best fit BC03 model (green line) and the infrared part with a range of observed and model SEDs. The red square denotes the upper limit at 24 μm. Cut-out images of the source are shown in Fig. 1, 6th row.
Current usage metrics show cumulative count of Article Views (full-text article views including HTML views, PDF and ePub downloads, according to the available data) and Abstracts Views on Vision4Press platform.
Data correspond to usage on the plateform after 2015. The current usage metrics is available 48-96 hours after online publication and is updated daily on week days.
Initial download of the metrics may take a while.