Free Access
Fig. 5
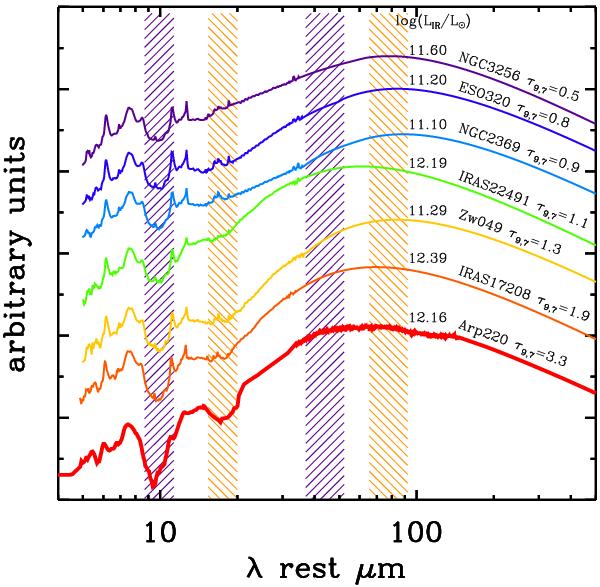
A large range of rest frame SEDs of local ULIRGs and LIRGs, presented in increasing order of silicate optical depth. The mid-IR part is the IRS spectrum (Armus et al. 2007), while the far-IR comes from Rieke et al. (2009) templates. Blue (orange) stripes correspond to MIPS 24- and PACS 100 μm bands at z = 1.3 (0.3).
Current usage metrics show cumulative count of Article Views (full-text article views including HTML views, PDF and ePub downloads, according to the available data) and Abstracts Views on Vision4Press platform.
Data correspond to usage on the plateform after 2015. The current usage metrics is available 48-96 hours after online publication and is updated daily on week days.
Initial download of the metrics may take a while.