Fig. 4
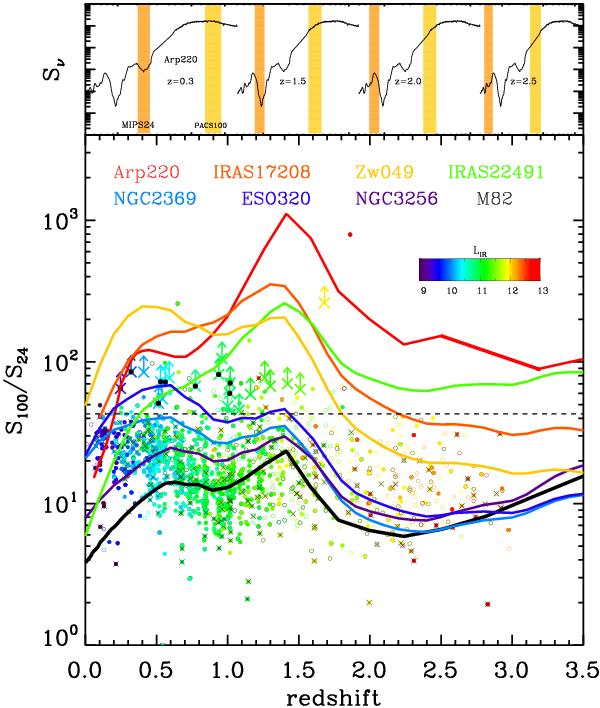
S100/S24 as a function of redshift for the whole GOODS-H sample (circles) and lower limits for the 24 μm dropouts (arrows). Both samples are colour coded based on their LIR. Sources with a black cross are AGNs based on their X-ray emission. Filled symbols denote sources in the GOODS-H sample with spectroscopic redshift, while open symbols are sources with photometric redshift. Similarly, black circles on top of the arrows indicate that a spectroscopic redshift is available for that MIPS dropout source. Solid lines correspond to different observed SEDs of local LIRGs/ULIRGs (see Fig. 5) and horizontal black dashed line to S100/S24 = 43. The pop panel shows the SED of Arp220 at various redshifts along with the MIPS 24- and PACS 100 μm bands.
Current usage metrics show cumulative count of Article Views (full-text article views including HTML views, PDF and ePub downloads, according to the available data) and Abstracts Views on Vision4Press platform.
Data correspond to usage on the plateform after 2015. The current usage metrics is available 48-96 hours after online publication and is updated daily on week days.
Initial download of the metrics may take a while.