Fig. 2
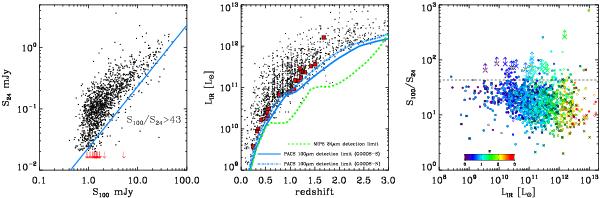
Left: S24 vs. S100 flux densities for the whole GOODS-H sample (black circles) as well as for the 24 μm dropout sources (red arrows). For the dropouts we consider a 3σ upper limit for the S24. Dropouts as well as some 24 μm detected sources tend to depart from the bulk of the GOODS-H population, exhibiting redder S100/S24 colours. The cyan line corresponds to S100/S24 = 43. As discussed latter in the paper, sources with S100/S24 > 43 are classified as silicate-break galaxies. Middle: detection limits as a function of redshift for the GOODS-N and GOODS-S PACS 100 μm and MIPS 24 μm observations. Red squares correspond to the drop-out sources. Right: S100/S24 as a function of LIR as derived by Herschel for the whole GOODS-H sample (circles) and lower limits for the 24 μm dropouts (arrows). Both samples are colour coded based on their redshift. Sources with a black cross are AGNs based on their X-ray emission. Filled symbols denote sources in the GOODS-H sample with spectroscopic redshifts while open symbols sources with photometric redshift. Similarly, yellow circles on top of the arrows indicate that a spectroscopic redshift is available for that 24 μm dropout source. The horizontal black dashed line corresponds to S100/S24 = 43.
Current usage metrics show cumulative count of Article Views (full-text article views including HTML views, PDF and ePub downloads, according to the available data) and Abstracts Views on Vision4Press platform.
Data correspond to usage on the plateform after 2015. The current usage metrics is available 48-96 hours after online publication and is updated daily on week days.
Initial download of the metrics may take a while.