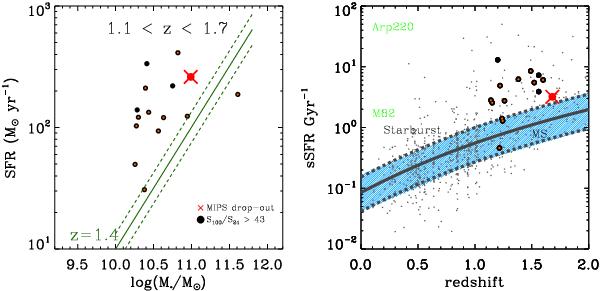
Fig. 13

Left: the SFR − M∗ relation for sources with S100/S24 > 43 at 1.1 < z < 1.7 (black circles). Orange dots indicate sources with spectroscopic redshift. Red cross corresponds to the ULIRG dropout that we presented in Sect. 3.3. The solid green line depicts the SFR − M∗ correlation at z ~ 1.4 (Elbaz et al. 2011), while the dashed lines indicate its dispersion. Right: specific star formation rate (sSFR), as a function of redshift, for the same sample as in the left panel, as well as for the whole GOODS-H sample (grey dots). The gray thick line denotes the evolution of the sSFR with redshift, as derived by individual detections and stacking analysis of the GOODS-H sample by Elbaz et al. (2011). The blue shaded area along with the dashed gray lines which correspond to the dispersion of the evolution (~0.3 dex), indicate the region of main sequence galaxies. Sources with S100/S24 > 43 tend to be found above the blue shaded area, populating the starburst region. The green text indicates the position of Arp 220 and M 82 (shifted to z = 0.1 for clarity).
Current usage metrics show cumulative count of Article Views (full-text article views including HTML views, PDF and ePub downloads, according to the available data) and Abstracts Views on Vision4Press platform.
Data correspond to usage on the plateform after 2015. The current usage metrics is available 48-96 hours after online publication and is updated daily on week days.
Initial download of the metrics may take a while.


