Fig. 12
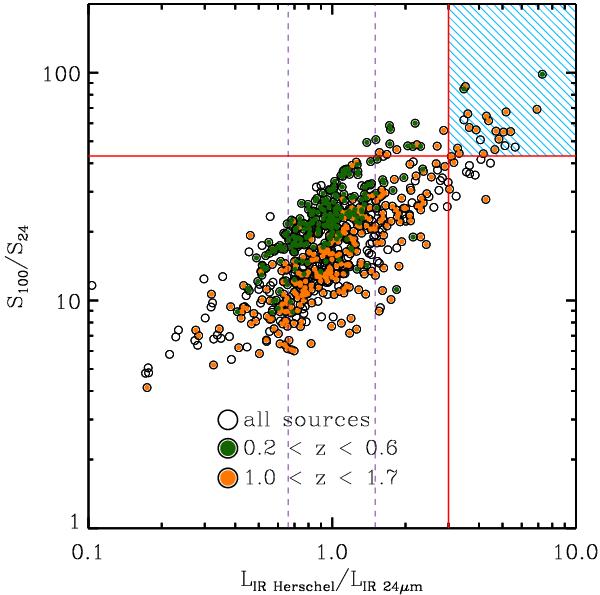
S100/S24 as a function of the Herschel derived LIR over the LIR derived based only on the 24 μm flux densities. Green circles are sources at 0.2 < z < 0.6 and orange circles are sources at 1.0 < z < 1.7. The top right box (defined by S100/S24 > 43 and LIR Herschel/LIR 24 > 3) consists mainly of sources at 1.0 < z < 1.7. Vertical dashed lines indicate the area where the two LIR estimates agree within a factor of 1.5.
Current usage metrics show cumulative count of Article Views (full-text article views including HTML views, PDF and ePub downloads, according to the available data) and Abstracts Views on Vision4Press platform.
Data correspond to usage on the plateform after 2015. The current usage metrics is available 48-96 hours after online publication and is updated daily on week days.
Initial download of the metrics may take a while.