Fig. 11
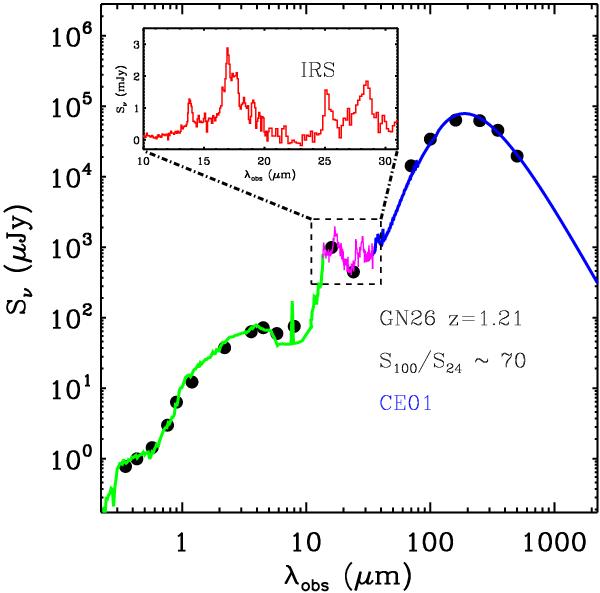
Full SED of GN26, a source at z = 1.21 with S100/S24 ~ 70. The far-IR part of the SED is derived from Herschel data and is overlaid with the best fit CE01 model. The mid-IR part of the SED is the observed IRS spectrum from Pope et al. (2008), that is also presented separately in the inset figure. We also show the optical/near-IR part of the SED along with the best fit BC03 model.
Current usage metrics show cumulative count of Article Views (full-text article views including HTML views, PDF and ePub downloads, according to the available data) and Abstracts Views on Vision4Press platform.
Data correspond to usage on the plateform after 2015. The current usage metrics is available 48-96 hours after online publication and is updated daily on week days.
Initial download of the metrics may take a while.