Free Access
Fig. 10
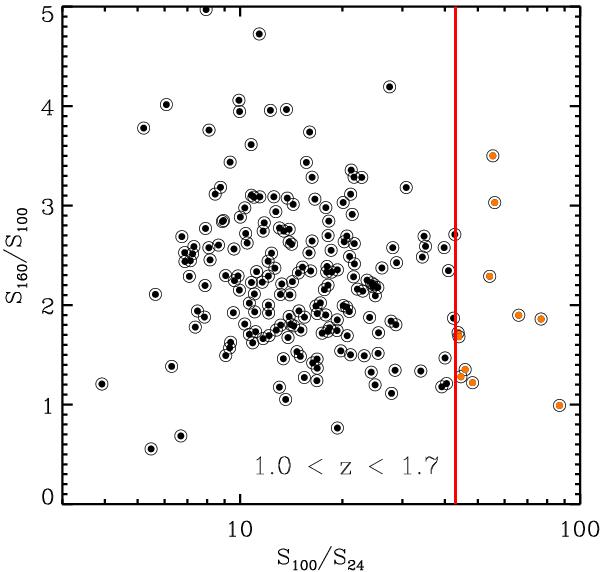
S160/S100 vs. S100/S24 colour − colour diagram for sources in the GOODS-H sample at 1.0 < z < 1.7. Sources with S100/S24 > 43 and S16/S8 > 4 are filled with orange colour. This plot demonstrates that our selection is not biased towards warmer sources.
Current usage metrics show cumulative count of Article Views (full-text article views including HTML views, PDF and ePub downloads, according to the available data) and Abstracts Views on Vision4Press platform.
Data correspond to usage on the plateform after 2015. The current usage metrics is available 48-96 hours after online publication and is updated daily on week days.
Initial download of the metrics may take a while.