Fig. 1
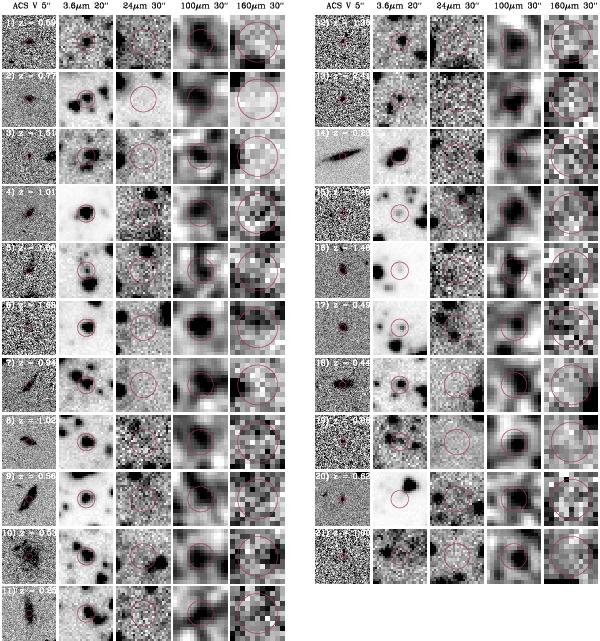
ACS V-band (5′′ × 5′′), IRAC 3.6 μm (20′′ × 20′′), MIPS24 μm (30′′ × 30′′), and PACS 100-, 160 μm (30′′ × 30′′) cut-out images of the 24 μm dropout sources from our sample. The red circles are centred at the IRAC 3.6 μm positions of the sources and their diameter corresponds to the FWHM at each band. The size of each image is denoted on the top of each column.
Current usage metrics show cumulative count of Article Views (full-text article views including HTML views, PDF and ePub downloads, according to the available data) and Abstracts Views on Vision4Press platform.
Data correspond to usage on the plateform after 2015. The current usage metrics is available 48-96 hours after online publication and is updated daily on week days.
Initial download of the metrics may take a while.