Free Access
Fig. 7
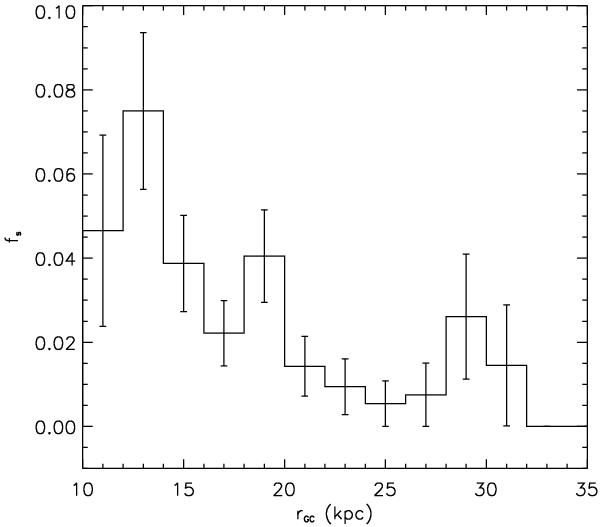
The ratio of CN-strong to CN-normal stars, fs, as a function of Galactocentric distance for the present data set and the MG10 data combined. Vertical error bars represent the Poisson errors on fs in each distance bin. The drop in the frequency of CN-strong stars seen in Fig. 5 at 20 kpc is also seen here.
Current usage metrics show cumulative count of Article Views (full-text article views including HTML views, PDF and ePub downloads, according to the available data) and Abstracts Views on Vision4Press platform.
Data correspond to usage on the plateform after 2015. The current usage metrics is available 48-96 hours after online publication and is updated daily on week days.
Initial download of the metrics may take a while.