Fig. 5
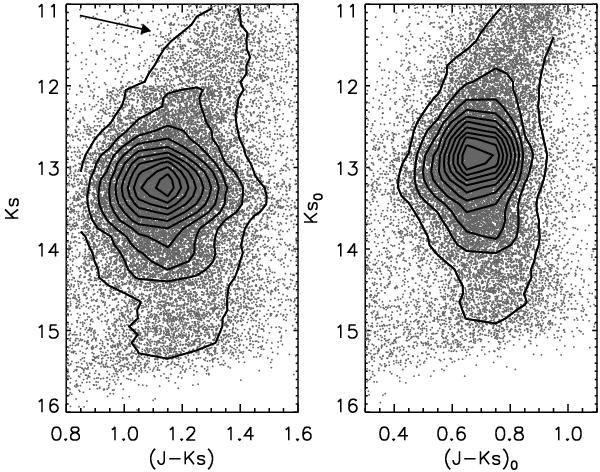
Red clump region of the observed color magnitude diagram for tile b306 (right panel) compared to the dereddened one obtained by our procedure (left panel). Only a subsample of the stars are plotted in each CMD and contour levels are shown to mark the clump position and shape. The arrow in the right panel shows the reddening vector for a change in E(B − V) of 0.5 mag.
Current usage metrics show cumulative count of Article Views (full-text article views including HTML views, PDF and ePub downloads, according to the available data) and Abstracts Views on Vision4Press platform.
Data correspond to usage on the plateform after 2015. The current usage metrics is available 48-96 hours after online publication and is updated daily on week days.
Initial download of the metrics may take a while.