Fig. 2
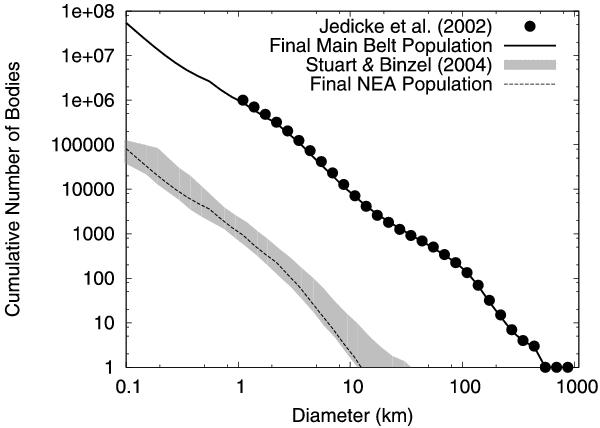
Our estimates of the main belt (solid line) and NEA (dashed line) size distributions for a pseudo-time of 9.5 Gyr. Moreover, the observed main belt size distribution from Bottke et al. (2005a), which is based on Jedicke et al. (2002) with a few changes, and the observed NEA size distribution from Stuart & Binzel (2004) are also shown.
Current usage metrics show cumulative count of Article Views (full-text article views including HTML views, PDF and ePub downloads, according to the available data) and Abstracts Views on Vision4Press platform.
Data correspond to usage on the plateform after 2015. The current usage metrics is available 48-96 hours after online publication and is updated daily on week days.
Initial download of the metrics may take a while.