Fig. 5
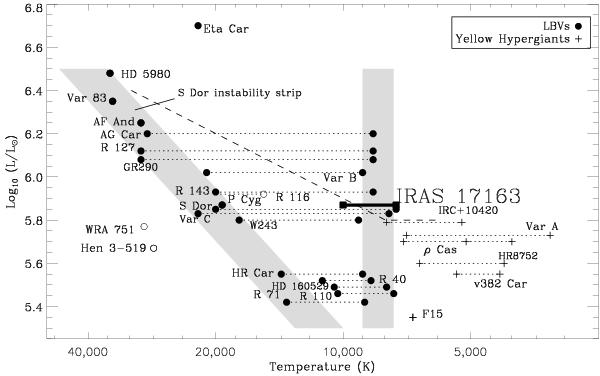
Temperature-luminosity diagram of post-red supergiants, showing that IRAS 17163 likely is a yellow hypergiant. The grey bands on the left and right of the diagram represent respectively the regimes in the HR diagram that the LBVs occupy when they are in the quiescent phase (left) and the active phase (right) at maximum visual brightness (Smith et al. 2004).
Current usage metrics show cumulative count of Article Views (full-text article views including HTML views, PDF and ePub downloads, according to the available data) and Abstracts Views on Vision4Press platform.
Data correspond to usage on the plateform after 2015. The current usage metrics is available 48-96 hours after online publication and is updated daily on week days.
Initial download of the metrics may take a while.