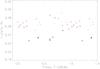
Fig. 2
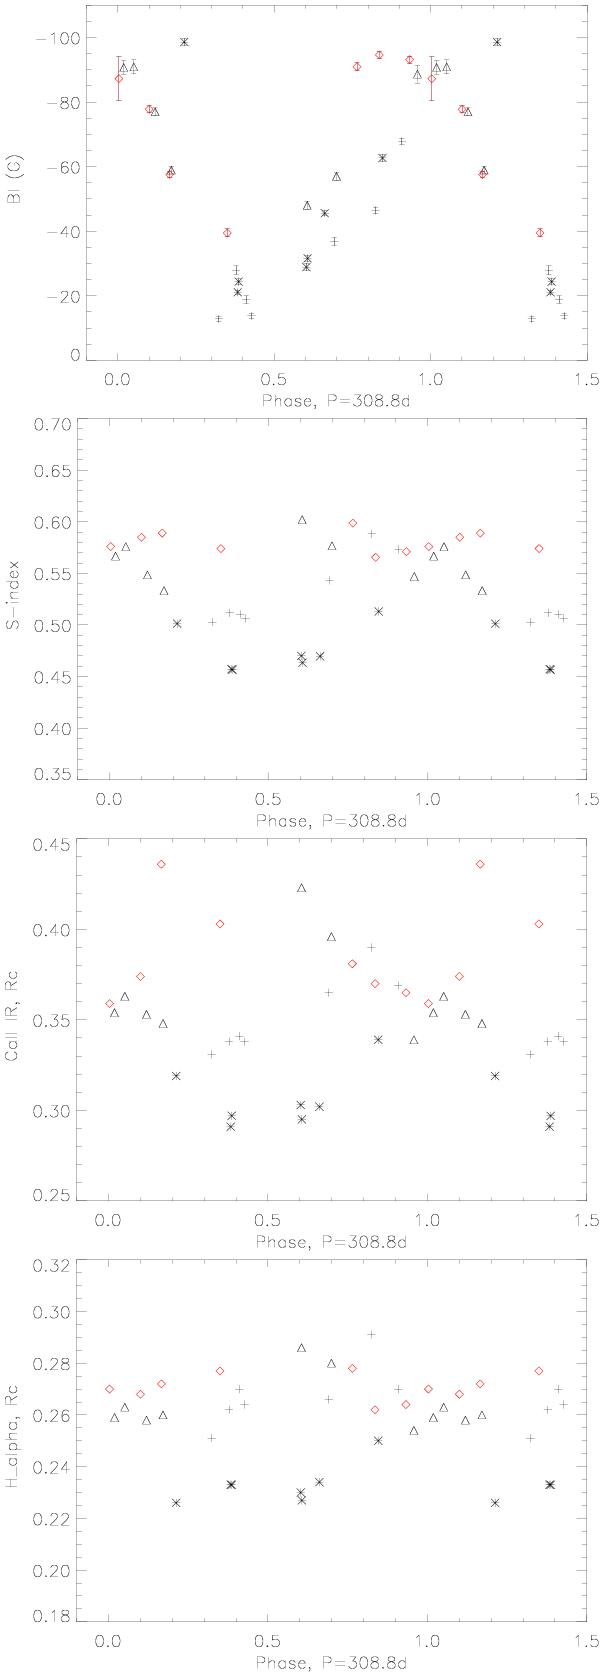
Variations of the longitudinal magnetic field Bℓ (upper panel) and of the activity indicators (lower panels), with photometric phase. The lower panels, from top to bottom, show: S-index, Rc for Ca ii IR lines and Hα. Different symbols represent different observing seasons: stars: 2007–2008, crosses: 2008–2009, triangles: 2009–2010, diamonds: 2010–2011; the 2010–2011 season is shown in red.
Current usage metrics show cumulative count of Article Views (full-text article views including HTML views, PDF and ePub downloads, according to the available data) and Abstracts Views on Vision4Press platform.
Data correspond to usage on the plateform after 2015. The current usage metrics is available 48-96 hours after online publication and is updated daily on week days.
Initial download of the metrics may take a while.