Fig. 1
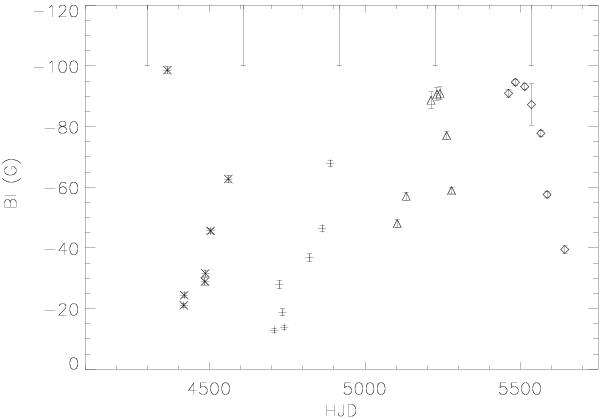
Variations of the longitudinal magnetic field Bℓ in G versus HJD (minus 2 450 000). Different symbols represent different observing seasons: stars: 2007–2008, crosses: 2008–2009, triangles: 2009–2010, diamonds: 2010–2011. Vertical marks at the top of the figure indicate the times of photometric minima according to the ephemeris of DBSS10.
Current usage metrics show cumulative count of Article Views (full-text article views including HTML views, PDF and ePub downloads, according to the available data) and Abstracts Views on Vision4Press platform.
Data correspond to usage on the plateform after 2015. The current usage metrics is available 48-96 hours after online publication and is updated daily on week days.
Initial download of the metrics may take a while.