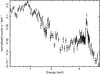
Fig. 1
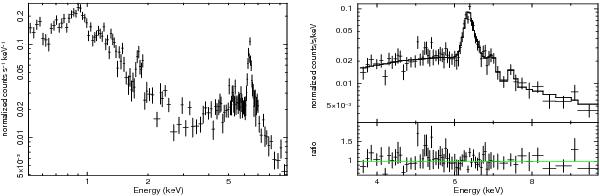
(a) Left: XMM-Newton PN spectrum resulting from the merging of the 2007 February and March observations of ESO 138 − G1. (b) Right: the RD model fitted to the 3.5 − 10 keV spectrum of ESO 138 − G1. This model consists of a Compton reflection continuum component and five Gaussian lines accounting for the neutral Fe Kα line, its Compton shoulder, and the He-like Fe Kα, Fe Kβ, and Ni Kα emission lines, respectively. The bottom panel shows the data-to-model ratios.
Current usage metrics show cumulative count of Article Views (full-text article views including HTML views, PDF and ePub downloads, according to the available data) and Abstracts Views on Vision4Press platform.
Data correspond to usage on the plateform after 2015. The current usage metrics is available 48-96 hours after online publication and is updated daily on week days.
Initial download of the metrics may take a while.