Fig. 2
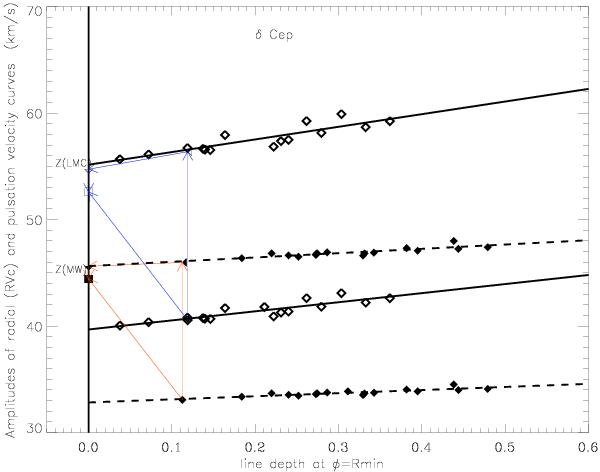
The decomposition of the projection factor. The filled and open diamonds correspond to the Milky Way and LMC models of δ Cep. For a given model, the lower (resp. higher) values are the amplitudes of the radial (resp. pulsation) velocity curves for each spectral line considered. The red and blue arrows indicate the decomposition of the projection factor for the MW and LMC respectively: ↑ (p0), ← (fgrad), ↓ (fog) and ↖ (p = p0fgradfog). For detailed explanations, refer to Nardetto et al. (2007).
Current usage metrics show cumulative count of Article Views (full-text article views including HTML views, PDF and ePub downloads, according to the available data) and Abstracts Views on Vision4Press platform.
Data correspond to usage on the plateform after 2015. The current usage metrics is available 48-96 hours after online publication and is updated daily on week days.
Initial download of the metrics may take a while.