Fig. 1
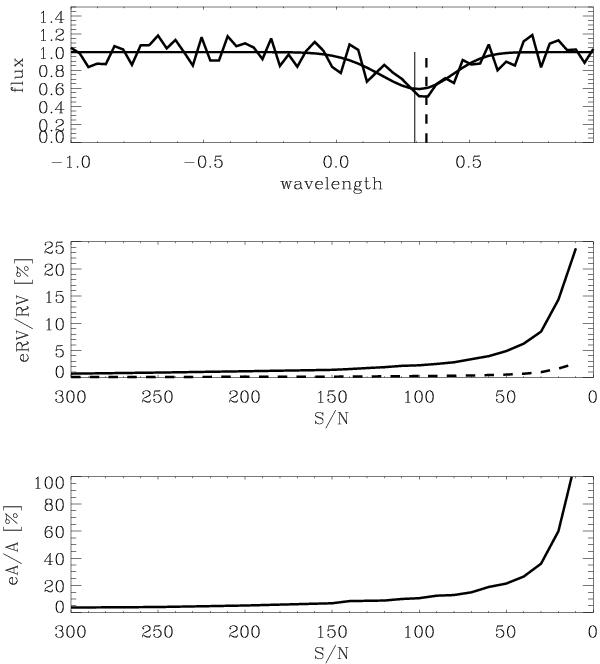
a) The modelled random spectral line profile derived from our toy model (with Vrad = 20 km s-1) together with the degraded profile (S/N of 10). The vertical lines correspond to the centroid (solid) and Gaussian (dashed) radial velocities. One hundred random spectral lines are calculated. b) The relative uncertainties of the radial velocities as a function of the S/N (same legend). c) The relative uncertainty on the bi-Gaussian line asymmetry as a function of the S/N.
Current usage metrics show cumulative count of Article Views (full-text article views including HTML views, PDF and ePub downloads, according to the available data) and Abstracts Views on Vision4Press platform.
Data correspond to usage on the plateform after 2015. The current usage metrics is available 48-96 hours after online publication and is updated daily on week days.
Initial download of the metrics may take a while.