Fig. 4
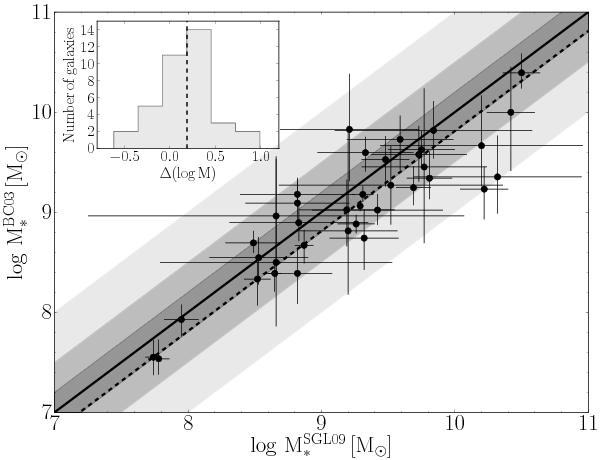
Comparison of stellar masses from the host sample of SGL09. The plot shows host masses derived from the photometry compiled in SGL09 and following Sect. 4.4.2 with models from Bruzual & Charlot (2003) against values directly taken from SGL09. Error bars are the maximum and minimum values of the stellar mass in the global χ2-distribution of 3 × 10⁶ galaxy templates (see Sect. 4.4.2). The solid lines represents equality, and the dashed line the median offset. Increasingly gray shaded areas indicate dispersions of 0.2, 0.5, and 1.0 dex, respectively. The inset shows the distribution of mass differences, which has a median of around 0.2 dex.
Current usage metrics show cumulative count of Article Views (full-text article views including HTML views, PDF and ePub downloads, according to the available data) and Abstracts Views on Vision4Press platform.
Data correspond to usage on the plateform after 2015. The current usage metrics is available 48-96 hours after online publication and is updated daily on week days.
Initial download of the metrics may take a while.