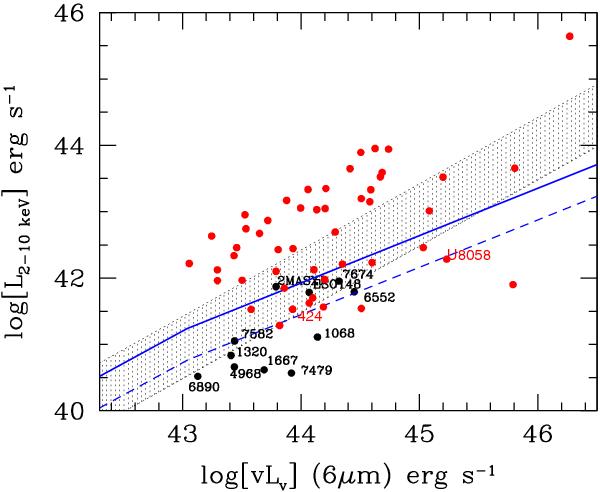
Fig. 2

Rest-frame LX versus (vs.) L6 μm luminosity diagram for the unambiguous AGN i.e. those with intrinsic X-ray 2–10 keV luminosity LX > 1042 erg s-1. The X-ray luminosity is uncorrected for absorption, while the mid-IR luminosity includes both the torus and the star-formation component. The black and the red circles correspond to the Compton-thick and Compton-thin sources in the AGN (LX > 1042 erg s-1) sample of Brightman & Nandra (2011a). The shaded area denotes the Compton-thick regime based on the average LX/L6 μm relation (corrected for obscuration) found for local AGN by Lutz et al. (2004) scaled down assuming a 3% fraction of reflected emission from the backside of the obscuring screen in the 2–10 keV band. The dispersion in this relation is ≈ 0.7 dex for type-2 AGN. The blue lines show the luminosity-dependent average relation for Compton-thick AGN based on the COSMOS AGN assuming a 3% (solid-line) and a 1% (dashed-line) fraction of reflected emission. Only one Compton-thick source (2MASX J15504152) lies above the nominal Compton-thick regime as defined by the Fiore et al. (2009) average relation assuming a 3% reflection.
Current usage metrics show cumulative count of Article Views (full-text article views including HTML views, PDF and ePub downloads, according to the available data) and Abstracts Views on Vision4Press platform.
Data correspond to usage on the plateform after 2015. The current usage metrics is available 48-96 hours after online publication and is updated daily on week days.
Initial download of the metrics may take a while.


