Fig. 5
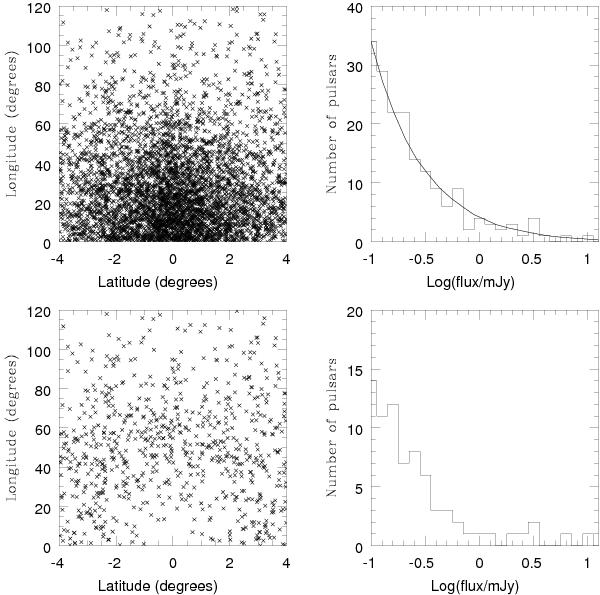
One simulation of the population of 30 000 millisecond pulsars in the Galaxy. Top: distribution of all (4589) short-period pulsars in the region of the blind survey and corresponding histogram of flux densities; the solid curve is the mean histogram from 1000 simulations. Bottom: distribution of the (730) pulsars remaining after eliminating the undetectable ones (because of pulse smearing at high dispersion measure) and corresponding histogram of flux densities. Both histograms are limited to flux densities higher than 0.1 mJy for clarity.
Current usage metrics show cumulative count of Article Views (full-text article views including HTML views, PDF and ePub downloads, according to the available data) and Abstracts Views on Vision4Press platform.
Data correspond to usage on the plateform after 2015. The current usage metrics is available 48-96 hours after online publication and is updated daily on week days.
Initial download of the metrics may take a while.