Fig. 3
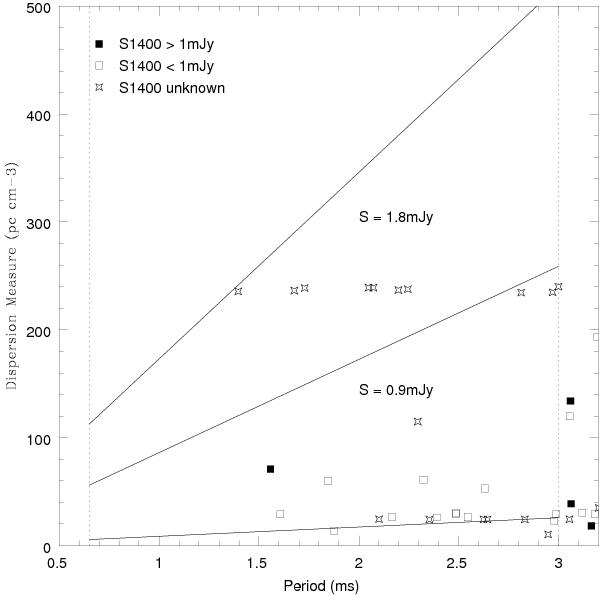
Dependence of the sensitivity on dispersion measure. The sensitivity decreases progressively toward higher dispersion measures. The diagonal lines correspond to a dispersion representing 0.1, 1, and 2 windows per frequency channel, respectively. The individual points are known millisecond pulsars with different symbols depending on their flux density at 1400 MHz.
Current usage metrics show cumulative count of Article Views (full-text article views including HTML views, PDF and ePub downloads, according to the available data) and Abstracts Views on Vision4Press platform.
Data correspond to usage on the plateform after 2015. The current usage metrics is available 48-96 hours after online publication and is updated daily on week days.
Initial download of the metrics may take a while.