Fig. 8
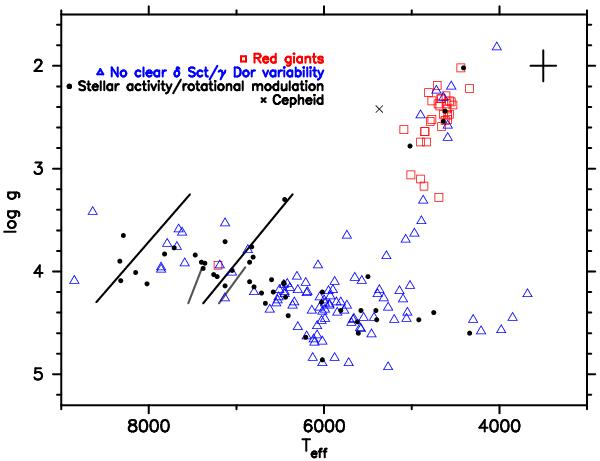
(Teff, log g)-diagram with stars that show no clear periodic variability on timescales typical for δ Sct and γ Dor pulsators (open triangles), stars identified as red giants (open squares), stars that exhibit stellar activity (bullet), and a Cepheid (cross). The cross at the right top corner represents the typical error bars on the values: 290 K for Teff and 0.3 dex for log g. The solid thick black and light grey lines mark the blue and red edge of the observed instability strips of δ Sct and γ Dor stars, as described by Rodríguez & Breger (2001) and Handler & Shobbrook (2002), respectively. In the on-line version of the paper the open squares, open triangles, bullets, and crosses, are red, blue, black, and black, respectively.
Current usage metrics show cumulative count of Article Views (full-text article views including HTML views, PDF and ePub downloads, according to the available data) and Abstracts Views on Vision4Press platform.
Data correspond to usage on the plateform after 2015. The current usage metrics is available 48-96 hours after online publication and is updated daily on week days.
Initial download of the metrics may take a while.