Fig. 3
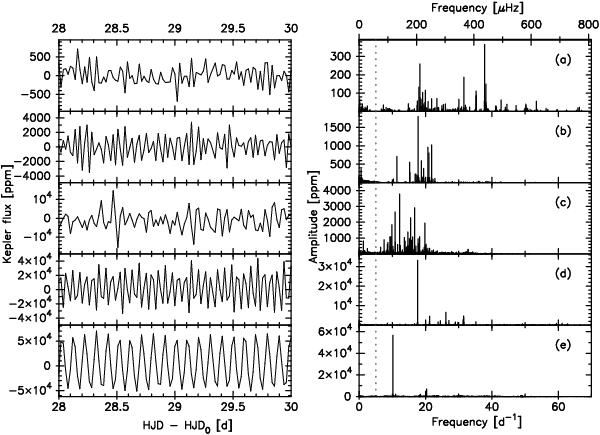
Light curve and frequency spectrum of five stars assigned to the δ Sct group, illustrating the variety of pulsational behaviour within the group. The left panel shows a portion of the Kepler light curves. The Kepler flux is expressed in ppm, HJD is given in d with respect to HJD0 = 2 454 950.0. The right panel gives a schematic representation of the detected independent frequencies, expressed in d-1 (bottom X-axis) or μHz (top X-axis). Amplitudes are given in ppm. The dotted grey line separates the δ Sct and γ Dor regime. Note the different Y-axis scales for each star. a) KIC 8415752; b) KIC 8103917; c) KIC10717871; d) KIC 9845907; e) KIC 9306095.
Current usage metrics show cumulative count of Article Views (full-text article views including HTML views, PDF and ePub downloads, according to the available data) and Abstracts Views on Vision4Press platform.
Data correspond to usage on the plateform after 2015. The current usage metrics is available 48-96 hours after online publication and is updated daily on week days.
Initial download of the metrics may take a while.