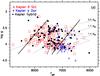
Fig. 10
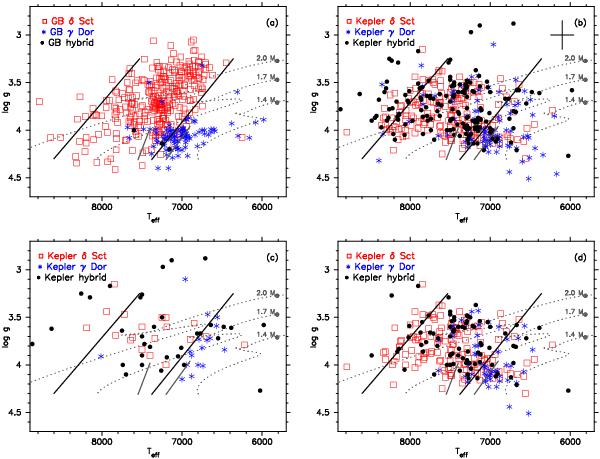
a) (Teff, log g)-diagram of the δ Sct, γ Dor, and hybrid stars detected from the ground (parameters taken from the literature). b) (Teff, log g)-diagram of the Kepler stars we classified as δ Sct, γ Dor, and hybrid stars in this paper. Open squares represent δ Sct stars, asterisks indicate γ Dor stars, and hybrid stars are marked by bullets. The black cross in the right top corner shows typical errors on the values. c) (Teff, log g)-diagram of the subsample of 69 Kepler stars for which accurate Teff and log g values are available. The colour-codes are the same as for panel b). d) (Teff, log g)-diagram of the subsample of Kepler stars that show pulsations with amplitudes higher than 1000 ppm (>1 mmag). Evolutionary tracks for MS stars with masses 1.4 M⊙, 1.7 M⊙, and 2.0 M⊙ are plotted with grey dotted lines. The evolutionary tracks have been computed using the Code Liégeois d’Évolution Stellaire (CLES, Scuflaire et al. 2008). The input physics included is similar to the one used in Dupret et al. (2005) with the following values for the modelling parameters αMLT = 1.8, αov = 0.2 and Z = 0.02. The solid thick black and light grey lines mark the blue and red edge of the observed instability strips of δ Sct and γ Dor stars, as described by Rodríguez & Breger (2001) and Handler & Shobbrook (2002), respectively. In the on-line version of the paper the symbols representing the δ Sct, γ Dor, and hybrid stars are red, blue, and black, respectively.
Current usage metrics show cumulative count of Article Views (full-text article views including HTML views, PDF and ePub downloads, according to the available data) and Abstracts Views on Vision4Press platform.
Data correspond to usage on the plateform after 2015. The current usage metrics is available 48-96 hours after online publication and is updated daily on week days.
Initial download of the metrics may take a while.