Fig. 3
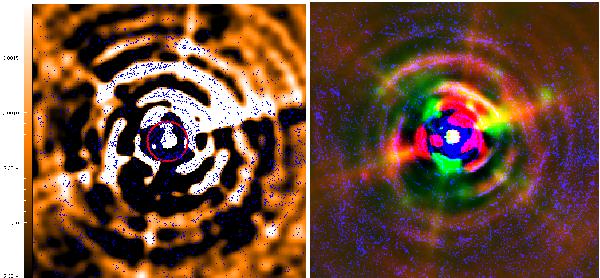
Comparison between PACS images and deconvolved VLT/FORS1 V-band image (see Fig. 4 in Leão et al. 2006). The field-of-view is 204′′ × 204′′. Left-hand image: deconvolved PACS 100 μm image after subtraction of the smooth halo of the circumstellar envelope (flux units being mJy/arcsec2) with superposed contours (in blue) of the V-band image by Leão et al. (2006). The red circle marks the region in which the flux is unreliable because of PSF artefacts (see Fig. 2). Right-hand image: combined image of the PACS 70 μm (green), PACS 100 μm (red), and V-band image (blue). The outermost arcs detected in the V-band image (at a radius of ~ 32′′, 53′′, and 73′′) are clearly seen in the PACS images as well. (For the best result, viewing this figure electronically is recommended.)
Current usage metrics show cumulative count of Article Views (full-text article views including HTML views, PDF and ePub downloads, according to the available data) and Abstracts Views on Vision4Press platform.
Data correspond to usage on the plateform after 2015. The current usage metrics is available 48-96 hours after online publication and is updated daily on week days.
Initial download of the metrics may take a while.