Fig. 2
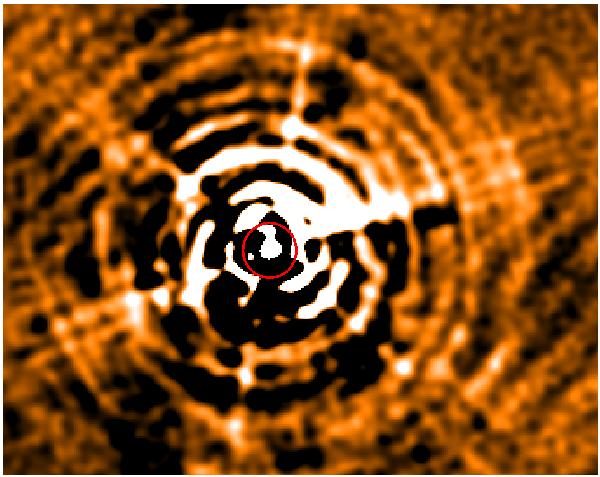
Zoom into the inner 5′30′′ × 4′30′′ of the PACS 100 μm image (cf. the middle panel in the right-hand column of Fig. 1). The red circle with a radius of 15′′ marks the region where some PSF artefacts are still visible.
Current usage metrics show cumulative count of Article Views (full-text article views including HTML views, PDF and ePub downloads, according to the available data) and Abstracts Views on Vision4Press platform.
Data correspond to usage on the plateform after 2015. The current usage metrics is available 48-96 hours after online publication and is updated daily on week days.
Initial download of the metrics may take a while.