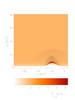
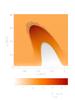
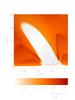
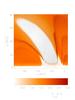
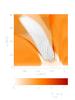
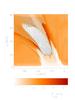
Fig. 4

Temperature (color maps) and velocity (arrows) profiles at t = 25 s, t = 200 s, t = 500 s, t = 600 s, t = 700 s, t = 800 s, t = 900 s, t = 1000 s, and t = 1200 s (from top-left to bottom-right). Temperature is drawn in units of 1 MK. The arrow below each panel represents the length of the velocity vector, expressed in units of 150 km s-1.


Current usage metrics show cumulative count of Article Views (full-text article views including HTML views, PDF and ePub downloads, according to the available data) and Abstracts Views on Vision4Press platform.
Data correspond to usage on the plateform after 2015. The current usage metrics is available 48-96 hours after online publication and is updated daily on week days.
Initial download of the metrics may take a while.