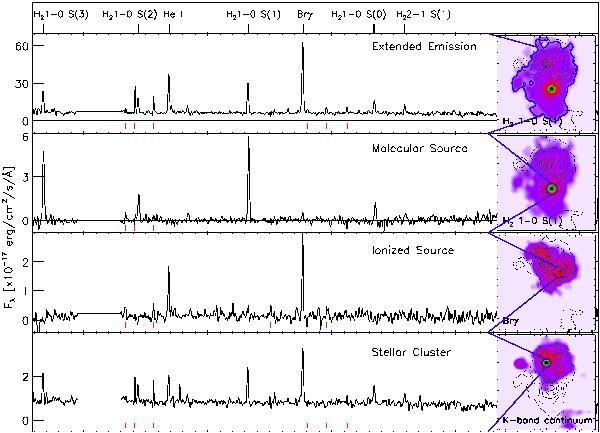
Fig. 4

Integrated SINFONI spectra for the four different components in our pointing of the overlap region of the Antennae. All spectra are smoothed by 3 bins in wavelength. Around 2.0 μm the atmospheric transmission is very low so we did not plot this part of the spectra. We mark in red the wavelengths of the strong night sky lines seen in the spectra (OH lines). In the right panel, blue contours mark the aperture from which each spectrum was extracted.
Current usage metrics show cumulative count of Article Views (full-text article views including HTML views, PDF and ePub downloads, according to the available data) and Abstracts Views on Vision4Press platform.
Data correspond to usage on the plateform after 2015. The current usage metrics is available 48-96 hours after online publication and is updated daily on week days.
Initial download of the metrics may take a while.


