Fig. 5
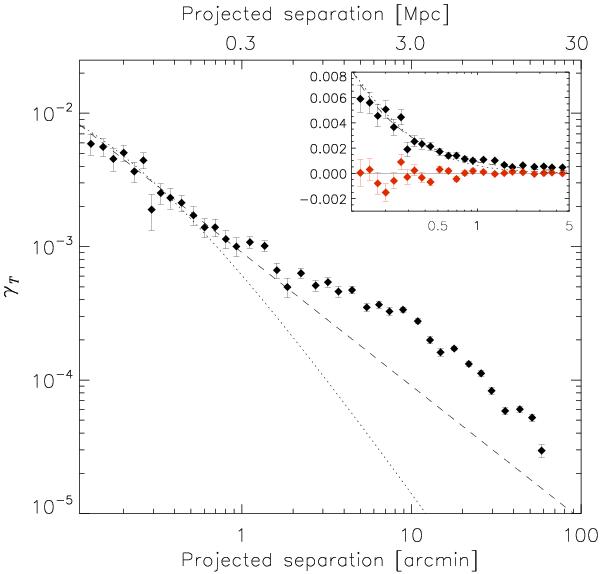
Galaxy-mass cross-correlation function around 7.3 × 10⁵ apparent magnitude selected lenses measured with 5.9 × 10⁶ sources. The black symbols are the tangential shear, the red symbols are the cross shear. The top axis shows the projected separation in physical units for the median lens redshift zmed = 0.34. The inset shows the signal on a linear scale for small separations. The signal has been corrected for contributions from systematic shear, and boosted to account for source galaxy contamination. The dashed (dotted) line shows the best fit SIS (NFW), fitted to the shear on scales between 0.2 and 0.6 arcmin. The clustering of galaxies causes excess shear at scales >1 arcmin.
Current usage metrics show cumulative count of Article Views (full-text article views including HTML views, PDF and ePub downloads, according to the available data) and Abstracts Views on Vision4Press platform.
Data correspond to usage on the plateform after 2015. The current usage metrics is available 48-96 hours after online publication and is updated daily on week days.
Initial download of the metrics may take a while.