Fig. C.3
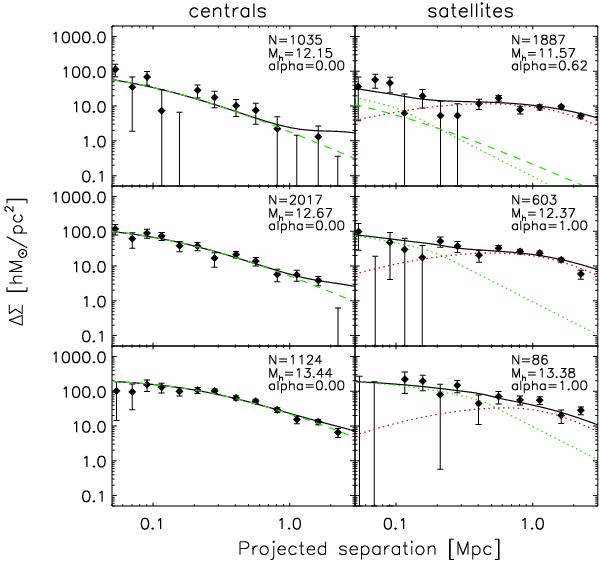
Lensing signal ΔΣ as a function of physical distance from the lens. The lensing signal is measured for central galaxies (left) and for the satellite galaxies (right), for the 1010.5 < M∗ < 1011.0 M⊙ bin (top), 1011.0 < M∗ < 1011.5 M⊙ bin (middle) and 1011.5 < M∗ < 1011.75 M⊙ bin (bottom). Indicated in each plot is the number of lenses, the logarithm of the best fit halo mass and the best fit satellite fraction. The shear signal is reduced at large lens-source separations for the central galaxies, indicating that they are isolated. At small lens-source separations the shear signal of the satellite sample appears to be reduced compared to the central sample. Note that the 2-halo terms are not shown for clarity.
Current usage metrics show cumulative count of Article Views (full-text article views including HTML views, PDF and ePub downloads, according to the available data) and Abstracts Views on Vision4Press platform.
Data correspond to usage on the plateform after 2015. The current usage metrics is available 48-96 hours after online publication and is updated daily on week days.
Initial download of the metrics may take a while.