Fig. B.1
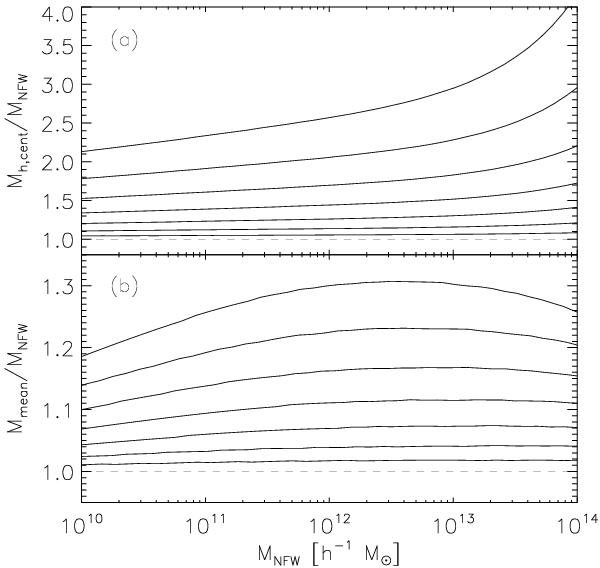
Ratio of the central mass of the halo mass distribution, Mh, cent, and the best fit NFW mass (top) and the ratio of the mean halo mass and the best fit NFW mass (bottom) as a function of best fit NFW mass. Different lines correspond to σmh values of 0.10 (bottom line), 0.15, 0.20, 0.25, 0.30, 0.35 and 0.40 (top line). The lensing mass is converted to the mean halo mass using the corrections from the bottom panel.
Current usage metrics show cumulative count of Article Views (full-text article views including HTML views, PDF and ePub downloads, according to the available data) and Abstracts Views on Vision4Press platform.
Data correspond to usage on the plateform after 2015. The current usage metrics is available 48-96 hours after online publication and is updated daily on week days.
Initial download of the metrics may take a while.