Fig. 2
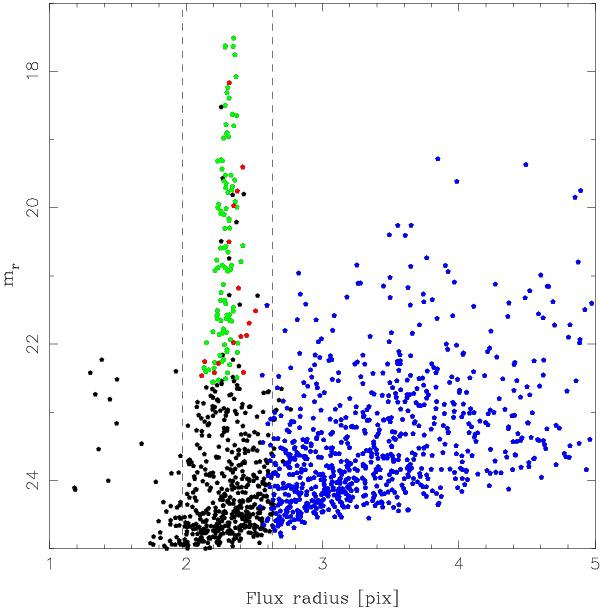
Size-magnitude diagram of one of the chips in a randomly picked exposure. The black dots are the SExtractor detections, the green dots are the selected stars, the red dots are the 3-sigma outliers, and the blue dots are the selected galaxies. The dashed lines indicate the location of the stellar branch. Thanks to the good image quality the stars are easily separated from the galaxies.
Current usage metrics show cumulative count of Article Views (full-text article views including HTML views, PDF and ePub downloads, according to the available data) and Abstracts Views on Vision4Press platform.
Data correspond to usage on the plateform after 2015. The current usage metrics is available 48-96 hours after online publication and is updated daily on week days.
Initial download of the metrics may take a while.