Fig. 14
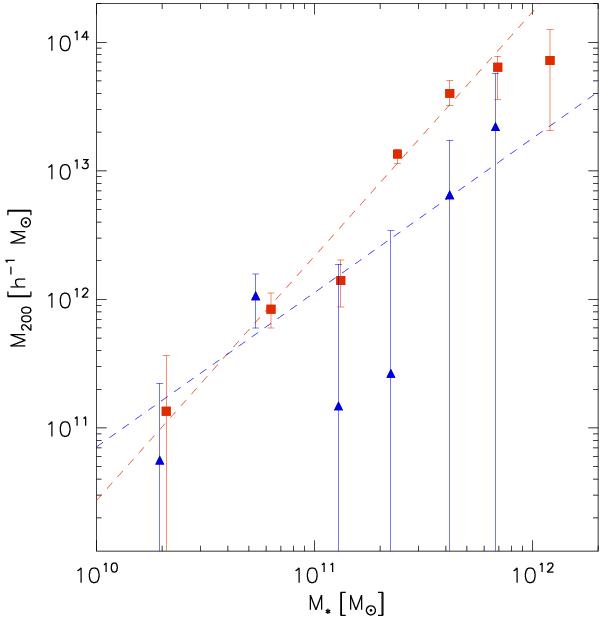
Best fit halo mass as a function of mean stellar mass. The red squares (blue triangles) denote the early-type (late-type) galaxies. The separation of the lenses into early/late-types is based on their brightness profiles. The dashed lines are the powerlaw fits, with values as indicated in the text. For stellar masses lower than 1011 M⊙ the best fit halo masses of early- and late-type galaxies are similar, but for M∗ > 1011 M⊙ we find that the best fit halo masses of early-types are greater.
Current usage metrics show cumulative count of Article Views (full-text article views including HTML views, PDF and ePub downloads, according to the available data) and Abstracts Views on Vision4Press platform.
Data correspond to usage on the plateform after 2015. The current usage metrics is available 48-96 hours after online publication and is updated daily on week days.
Initial download of the metrics may take a while.