Fig. 11
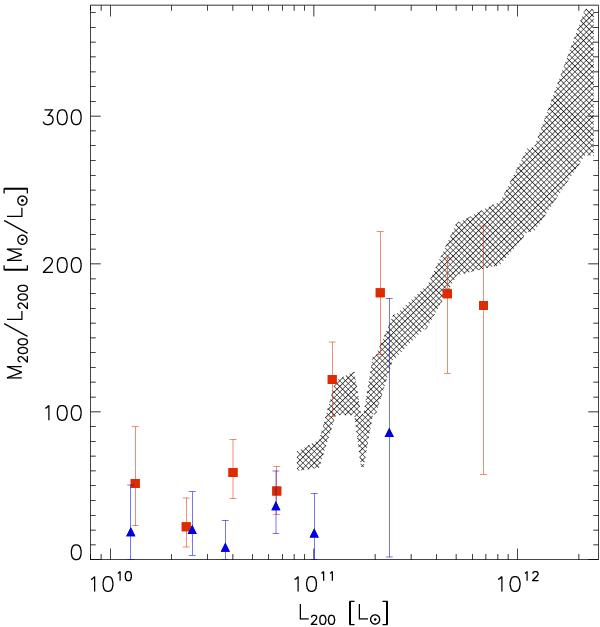
Mass-to-light ratio using the total halo mass and luminosity within r200, as a function of L200. The red squares (blue triangles) denote the early-type (late-type) results. The hatched area indicates the converted M200/L200 of the maxBCG clusters from Sheldon et al. (2009a). The M200/L200 for individual galaxies at low luminosities are naturally extended to the ratios for the maxBCG clusters.
Current usage metrics show cumulative count of Article Views (full-text article views including HTML views, PDF and ePub downloads, according to the available data) and Abstracts Views on Vision4Press platform.
Data correspond to usage on the plateform after 2015. The current usage metrics is available 48-96 hours after online publication and is updated daily on week days.
Initial download of the metrics may take a while.