Fig. 1
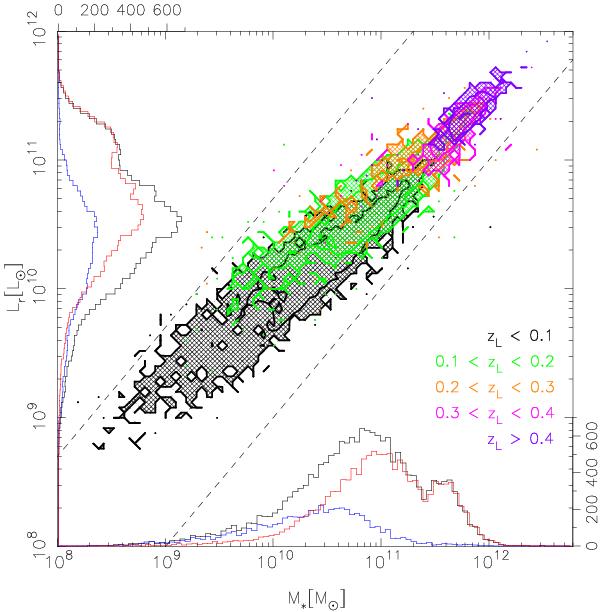
Stellar mass versus luminosity of the lens sample. The colour coding represents the redshift of the galaxies as denoted in the lower right-hand corner. The histograms for all galaxies (black line), the early-types (red line) and the late-types (blue line), as a function of stellar mass and luminosity are also shown, and are drawn slightly offset for clarity. The dashed diagonal lines indicate the additional mass-to-light ratio cuts we have applied (objects with M∗/Lr between 0.2 and 10 have been selected) to remove outliers that may contaminate the lensing signal.
Current usage metrics show cumulative count of Article Views (full-text article views including HTML views, PDF and ePub downloads, according to the available data) and Abstracts Views on Vision4Press platform.
Data correspond to usage on the plateform after 2015. The current usage metrics is available 48-96 hours after online publication and is updated daily on week days.
Initial download of the metrics may take a while.