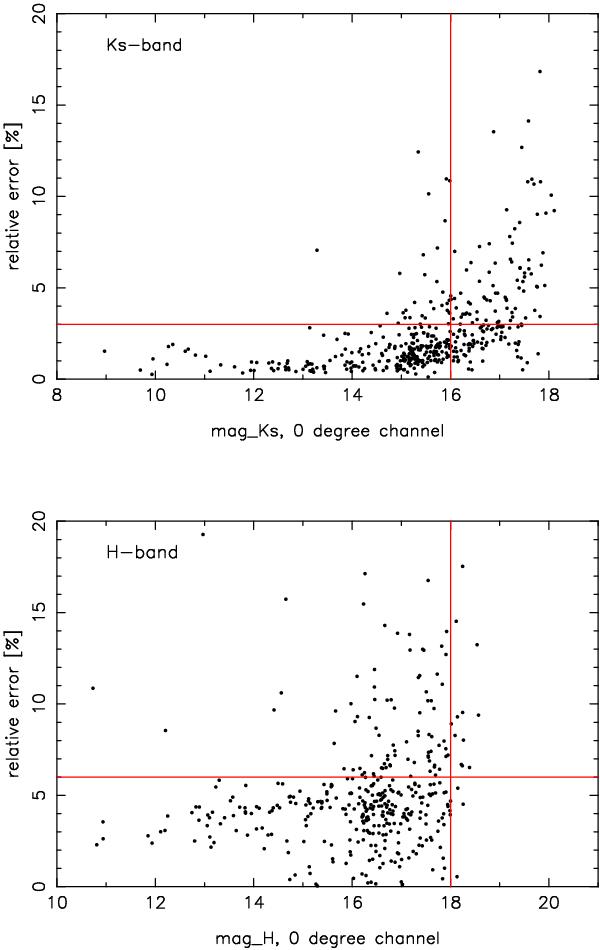
Fig. 3

Total relative flux errors of the sources detected in the Ks- (upper frame) resp. H-band (lower frame). Only the 0° channel is shown here, but the error distribution is very similar in the other three channels. The values are based on variations between the fluxes measured for the same source at different dither positions. The red lines denote the 16/18 mag resp. 3/6% upper limits (see Appendix A).
Current usage metrics show cumulative count of Article Views (full-text article views including HTML views, PDF and ePub downloads, according to the available data) and Abstracts Views on Vision4Press platform.
Data correspond to usage on the plateform after 2015. The current usage metrics is available 48-96 hours after online publication and is updated daily on week days.
Initial download of the metrics may take a while.


