Fig. 13
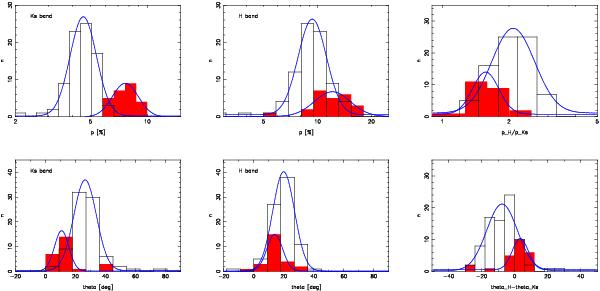
Sources detected in H- and Ks-band, separated by Ks-band polarization. White columns: pKs < 6%. Red columns: pKs > 6%. Upper/lower left frame: Ks-band polarization degree/angle, upper/lower middle frame: H-band polarization degree/angle, upper right frame: relation of H- and Ks-band polarization degree (logarithmic plot). Lower right frame: difference between H- and Ks-band polarization angle. Blue lines represent Gaussian fits to the histograms.
Current usage metrics show cumulative count of Article Views (full-text article views including HTML views, PDF and ePub downloads, according to the available data) and Abstracts Views on Vision4Press platform.
Data correspond to usage on the plateform after 2015. The current usage metrics is available 48-96 hours after online publication and is updated daily on week days.
Initial download of the metrics may take a while.