Fig. 6
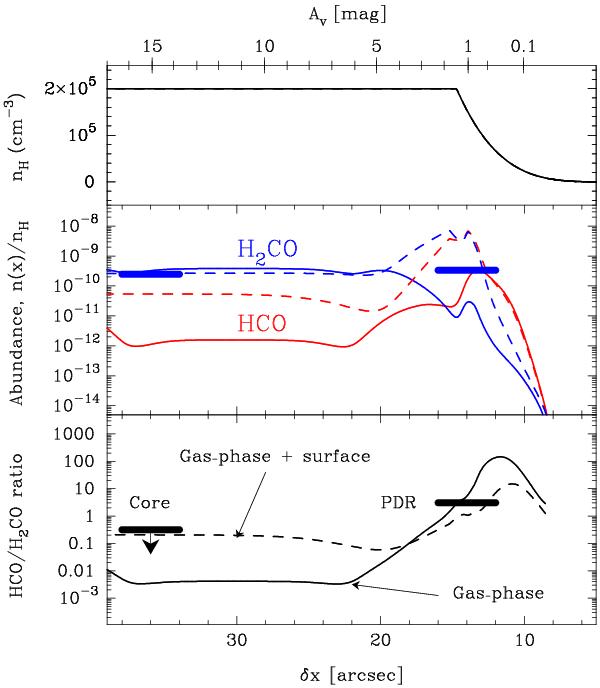
Photochemical model of the Horsehead PDR. Upper panel: PDR density profile (nH = n(H) + 2n(H2) in cm-3). Middle panel: predicted abundance (relative to nH) of H2CO (blue) and HCO (red). Lower panel: predicted HCO/H2CO abundance ratio. In the two bottom panels, models shown as solid lines include pure gas-phase chemistry and models shown as dashed lines include gas-phase as well as grain surface chemistry. The horizontal bars show the measured H2CO abundances and abundance ratios.
Current usage metrics show cumulative count of Article Views (full-text article views including HTML views, PDF and ePub downloads, according to the available data) and Abstracts Views on Vision4Press platform.
Data correspond to usage on the plateform after 2015. The current usage metrics is available 48-96 hours after online publication and is updated daily on week days.
Initial download of the metrics may take a while.