Fig. 1
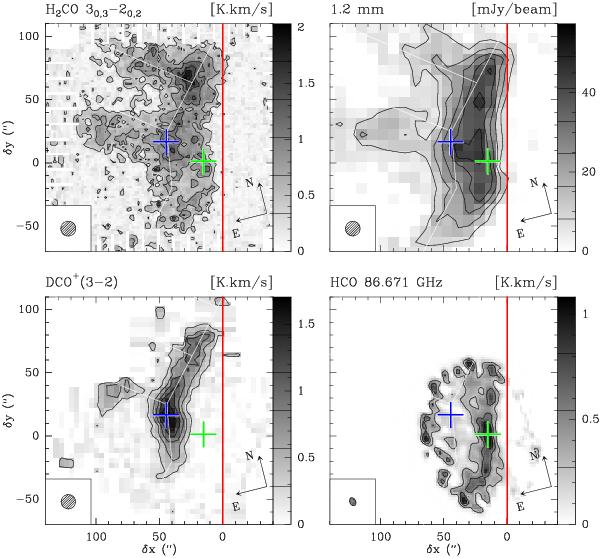
Integrated intensity maps of the Horsehead edge. The intensities are expressed in the main-beam temperature scale. Maps were rotated by 14° counter-clockwise around the projection center, located at (δx,δy) = (20′′,0′′), to bring the exciting star direction in the horizontal direction and the horizontal zero was set at the PDR edge, delineated by the red vertical line. The crosses show the positions of the PDR (green) and the dense-core (blue), where deep integrations were performed at IRAM-30m (see Fig. 3). The spatial resolution is plotted in the bottom left corner. Values of contour levels are shown on each image lookup table. The emission of all lines is integrated between 10.1 and 11.1 km s-1.
Current usage metrics show cumulative count of Article Views (full-text article views including HTML views, PDF and ePub downloads, according to the available data) and Abstracts Views on Vision4Press platform.
Data correspond to usage on the plateform after 2015. The current usage metrics is available 48-96 hours after online publication and is updated daily on week days.
Initial download of the metrics may take a while.