Free Access
Fig. 6
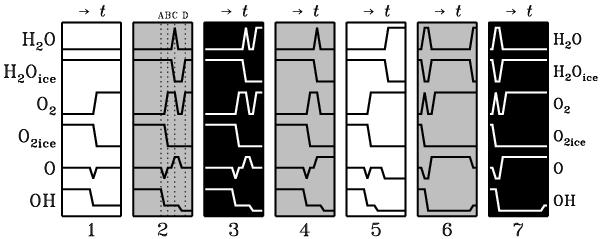
Qualitative evolution of some abundances towards the seven zones with different H2O histories from Fig. 4. The horizontal axes show the time (increasing from left to right) and are non-linear. The position of points A, B, C and D from Fig. 3 is indicated for zone 2, which contains our reference parcel.
Current usage metrics show cumulative count of Article Views (full-text article views including HTML views, PDF and ePub downloads, according to the available data) and Abstracts Views on Vision4Press platform.
Data correspond to usage on the plateform after 2015. The current usage metrics is available 48-96 hours after online publication and is updated daily on week days.
Initial download of the metrics may take a while.