Fig. 4
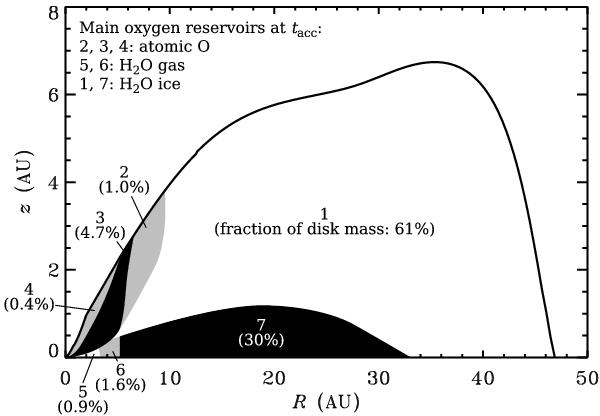
Schematic view of the history of H2O gas and ice throughout the disk. The main oxygen reservoir at tacc is indicated for each zone; the histories are described in the text. The percentages indicate the fraction of the disk mass contained in each zone. Note the disproportionality of the R and z axes. The colours have no specific meaning other than to distinguish the different zones.
Current usage metrics show cumulative count of Article Views (full-text article views including HTML views, PDF and ePub downloads, according to the available data) and Abstracts Views on Vision4Press platform.
Data correspond to usage on the plateform after 2015. The current usage metrics is available 48-96 hours after online publication and is updated daily on week days.
Initial download of the metrics may take a while.