Fig. 3
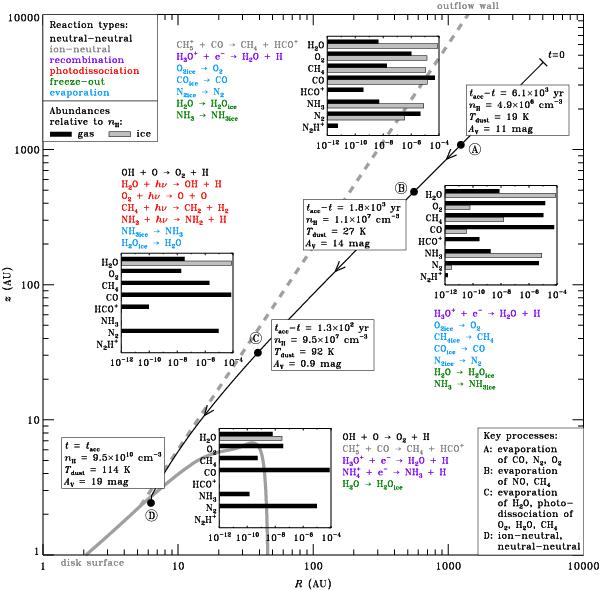
Overview of the chemistry along the infall trajectory (solid black curve) of the single parcel from Sect. 5.1. The solid and dashed grey lines denote the surface of the disk and the outflow wall, both at t = tacc = 2.52 × 10⁵ yr. Physical conditions, abundances (black bars: gas; grey bars: ice) and key reactions are indicated at four points (A, B, C and D) along the trajectory. The key processes governing the overall chemistry at each point are listed in the bottom right. The type of each reaction is indicated by colour, as listed in the top left.
Current usage metrics show cumulative count of Article Views (full-text article views including HTML views, PDF and ePub downloads, according to the available data) and Abstracts Views on Vision4Press platform.
Data correspond to usage on the plateform after 2015. The current usage metrics is available 48-96 hours after online publication and is updated daily on week days.
Initial download of the metrics may take a while.